
The most effective way to eliminate needless poverty blindness from the world is to prevent it from occurring in the first place. That is not easy. 90% of the world’s blindness occurs in low-and-middle-income countries where 80% of those who go blind could be cured or could have avoided going blind in the first place if they had had access to treatment.
Environmental factors also play a huge role, both at a macro level, where large-scale environmental change often feeds the cycle of poverty; and also at a micro level, where pollution and other irritants contribute directly to the kinds of eye infections and injuries that often lead to needless blindness.
So one of the most alarming trends in the world right now is how pervasive plastic pollution has become.
80% of the world’s ocean plastics enter the ocean via rivers and coastlines. The other 20% comes from marine sources such as fishing nets, ropes, and fleets. To tackle plastic pollution, we need to know where these plastics are coming from. Previous studies suggested that a very small number of rivers were responsible for the vast majority of ocean plastics: 60% to 90% of plastics come from only ten rivers.
Higher-resolution mapping and consideration for factors such as climate, terrain, land use, and distance to the ocean suggests that many smaller rivers may play a bigger role than first thought. In fact, it takes 1,600 of the biggest emitting rivers to account for 80% of plastic inputs to the ocean.
It is estimated that 81% of ocean plastics come from Asian rivers. The Philippines alone contributes around one-third of the global total. Since the number of contributing rivers is much higher than previously thought, we will need global efforts to improve waste management and plastic collection rather than targeting only a few of the largest rivers.

How Many Rivers Are Responsible For Transporting Plastic Into The World’s Oceans?
Previous studies suggested that most plastics come from only a few of the world’s rivers: one study estimated that the top ten rivers were responsible for 50% to 60%; another for more than 90%.
The latest research, published in Science Advances, updates our understanding of how these plastics are distributed. Lourens Meijer et al. (2021) developed high-resolution modelling of global riverine plastics. They found that rivers emitted around 1 million tonnes of plastics into the oceans in 2015 (with an uncertainty ranging from 0.8 to 2.7 million tonnes).
Around one-third of the 100,000 river outlets that they modelled contributed to this. The other two-thirds emitted almost no plastic to the ocean. It’s an important point because we might think that most, if not all, rivers are contributing to the problem. This is not the case.
But, importantly, the latest research suggests that smaller rivers play a much larger role than previously thought. In the chart above we see the comparison of the latest research (in red) with the two earlier studies which mapped global riverine inputs. This chart shows how many of the top-emitting rivers (on the x-axis) make up a given percentage of plastic inputs (y-axis). Note that the number of rivers on the x-axis is given on a logarithmic scale.
We see that the latest research suggests that the top ten emitting rivers contribute a much smaller amount than previously thought: just 18% of plastics compared to 56% and 91% from previous studies. And to account for 80% of river plastics we need to include the top 1,656 rivers. This compares to previous studies which suggested the largest five or 162 rivers were responsible for 80%.
This makes a massive difference in how we tackle plastic pollution. If five rivers were responsible for most of the problem then we should focus the majority of our efforts there. A targeted approach. But if this comprises thousands of rivers, then we’re going to need to cast a much wider net of mitigation efforts.
This latest analysis builds on this earlier research with much higher-resolution data. It models the deterministic drivers of how plastic is transported using wind and precipitation patterns and river discharge data – plus factors that affect the probability of plastic first entering rivers, then entering the ocean such as the proximity of populations to the river; distance to the ocean; the slope of the terrain, and types of land use. This higher-resolution data was based on several years of research and calibrations of these models across 66 rivers in 14 countries.
This higher-resolution data shows that these factors that affect the probability of plastics not only reaching the river but then also reaching the ocean play a much more important role than the size of the river basin itself. This means many smaller rivers play a bigger role than we thought.
Which Rivers Emit The Most Plastic To The Ocean?
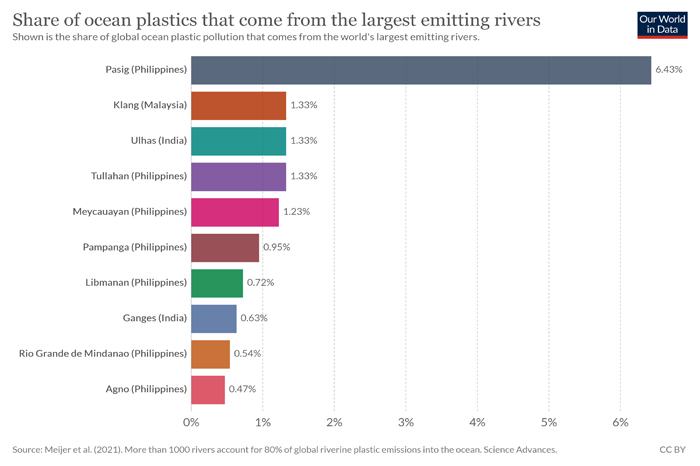
Most of the world’s largest emitting rivers are in Asia, with some also in East Africa and the Caribbean. In the chart we see the ten largest contributors. This is shown as each river’s share of the global total. You can explore the data on the top 50 rivers using the +Add river button on the chart.6
Seven of the top ten rivers are in the Philippines. Two are in India, and one in Malaysia. The Pasig River in the Philippines alone accounts for 6.4% of global river plastics. This paints a very different picture to earlier studies where it was Asia’s largest rivers – the Yangtze, Xi, and Huangpu rivers in China, and Ganges in India – that were dominant.

Which countries emit the most plastic to the ocean?
In the above chart we see the breakdown of global plastic inputs to the ocean by region. 81% of ocean plastics are emitted from Asia. The fact that a disproportionate amount of plastic pollution comes from Asia is consistent with previous research. Earlier studies estimated its share in 2010 was 86%.
This should also not surprise us given the fact that Asia is the world’s most populous region (home to 60% of the world population); plus all of the top ten emitting rivers were in Asia (Philippines, India, and Malaysia), and most of the top 50.
Africa was responsible for 8%; South America for 5.5%; North America for 4.5%; and Europe and Oceania combined were less than 1%.
To tackle plastic pollution, we need to know where it’s coming from
Identifying where plastic emissions are coming from really matters for how we tackle it. Rich countries emit very little – this means domestic strategies to reduce plastics in these countries will not make much difference to ocean plastics.
What rich countries can do is support low-to-middle income countries in improving waste management infrastructure. Improving waste management is a solution that very few people get excited about. But it’s absolutely key to tackling plastic pollution. And, importantly, they can ban the export of any plastics to other countries where it could be mismanaged.
Understanding the distribution of emissions across the world’s rivers is also crucial. Our strategy for tackling this problem is vastly different if we only have to focus on a few or even tens of the world’s largest rivers (as previous studies suggested) versus thousands of smaller ones.
To stop plastic pollution in our oceans we need a global approach to reducing plastic waste and managing it appropriately to stop it leaking into the natural environment. Focusing on a few rivers will not be enough.